The detection algorithm I came up with amounted to this: find the longest stretch of ones in a row, then find the second longest stretch of ones in a row (it can be a tie). Those sequences will mark the high peak before the low trough. The zero immediately following the sequence can be considered a transitional sample, and can be discarded. The next zero is virtually guaranteed to be very near the middle of the lowest low peak. These two points will mark the control channel's cycle, and represent a spread of 360 degrees.
There are 25 samples in that span (from Index 1 at 24, up to but not including Index 2 at 49), and so a 90 degree phase shift is represented by an index shift of 6.25. But since we are dealing with integers, we can use the lowest integer that is greater than or equal to the exact value, in this case 7. You can just get this mathematically with Index1 + (((Index2 - Index1)*N + T)/T) where N is the number of the control channel that is low at the time, and T is the total number of control channels, and N is always less than T, starting at 1. This formula is valid for LCD panels with only three control channels (assuming they are equally phase shifted at 120 degrees). I have not seen one with only two, but they apparently exist. I have not seen five, but I imagine they might exist too.
channel 0 = 24 = We knew this already, it is our baseline, and is not phase-shifted.
channel 1 = 24 + (((49 - 24)*1 + 4)/4) = index 31.25, but will render 31 after integer truncation. Delta is 7.
channel 2 = 24 + (((49 - 24)*2 + 4)/4) = index 37.50 -> 37, delta is 13 from index 1 (24)
channel 3 = 24 + (((49 - 24)*3 + 4)/4) = index 43.75 -> 43, delta is 19 from index 1.
This results in 7 increments for the first phase shift, 13 for the next, and 19 for the last.
Since I ultimately had 11 pins, I was able to put six on PORTC pins (Analog 0 through 5, accessed by the input pin register PINC) and five on PORTD (Digital pins 3 through 7, accessed by the input pin register PIND) - no need to sample PINB at all!
So the pin mapping is:
A0 = Control channel 0
A1 = LCD pin 4
A2 = LCD pin 7
A3 = LCD pin 8
A4 = LCD pin 9
A5 = LCD pin 10
D3 = LCD pin 11
D4 = LCD pin 12
D5 = LCD pin 13
D6 = LCD pin 14
D7 = LCD pin 15
I created a two dimensional array:
byte samples[2][56]; // array of sampling values
And the sampling procedure is nothing more than this:
int f=0;
while (f<56)
{
  samples[0][f] = PINC;
  samples[1][f] = PIND;
  delayMicroseconds(667);  // = 2/3 ms. three samples in 2 ms, which is the approximate pulse width.
  f++;
}
After the sample is taken, it can be analyzed. For humans, output in the form of a diagram is useful, and can be generated by code like this:
  i=0;
  while(i<16)
  {
    f=0;
    Serial.print(i, HEX); Serial.print(": "); }}
    while (f<56)
    {
      switch(i)
      {
	case 0:  if( (samples[0][f]& (1 << PINC0))) Serial.print("1"); else Serial.print("0"); break;
	case 4:  if( (samples[0][f]& (1 << PINC1))) Serial.print("1"); else Serial.print("0"); break;
	case 7:  if( (samples[0][f]& (1 << PINC2))) Serial.print("1"); else Serial.print("0"); break;
	case 8:  if( (samples[0][f]& (1 << PINC3))) Serial.print("1"); else Serial.print("0"); break;
	case 9:  if( (samples[0][f]& (1 << PINC4))) Serial.print("1"); else Serial.print("0"); break;
	case 10: if( (samples[0][f]& (1 << PINC5))) Serial.print("1"); else Serial.print("0"); break;
	case 11: if( (samples[1][f]& (1 << PIND3))) Serial.print("1"); else Serial.print("0"); break;
	case 12: if( (samples[1][f]& (1 << PIND4))) Serial.print("1"); else Serial.print("0"); break;
	case 13: if( (samples[1][f]& (1 << PIND5))) Serial.print("1"); else Serial.print("0"); break;
	case 14: if( (samples[1][f]& (1 << PIND6))) Serial.print("1"); else Serial.print("0"); break;
	case 15: if( (samples[1][f]& (1 << PIND7))) Serial.print("1"); else Serial.print("0"); break;
      }
      f++;
    }
    Serial.println();
    i++;
  }
There may be more efficient ways to do this but this is just printout for human eyes, is not interspersed in the sampling, and does not need to be efficient. This code is not included in the final program, it was just used for me to visualize and decide.
Anyway, with the blank pins removed, the output looks like this:
Index1 Index2
| |
V V
0: 0000011100011100011111100000001110001110001111110 0000011
4: 0011100011100011100011100001110001110001110001110 0011100
7: 0011100011100011100011100001110001110001110001110 0011100
8: 0011100011100011100011100001110001110001110001110 0011100
9: 0011100011100011100011100001110001110001110001110 0011100
A: 0011100011100011100011100001110001110001110001110 0011100
B: 0000000000000000000000000000000000000000000000000 0000000
C: 0011100011100011100011100001110001110001110001110 0011100
D: 0000011100011100011111100000001110001110001111110 0000011
E: 1100011111100011100000011110001111110001110000001 1100011
F: 0011100000011111100011100001110000001111110001110 0011100
The Index values are near the middle of the low peaks on control channel 0, as described.
Checking the values at the instant in time of Index 1, which is when control channel 0 is at its lowest, we can see this:
Index1 Index2
| |
V V
0: 000001110001110001111110 0 0000011100011100011111100000011
4: 001110001110001110001110 0 0011100011100011100011100011100
7: 001110001110001110001110 0 0011100011100011100011100011100
8: 001110001110001110001110 0 0011100011100011100011100011100
9: 001110001110001110001110 0 0011100011100011100011100011100
A: 001110001110001110001110 0 0011100011100011100011100011100
B: 000000000000000000000000 0 0000000000000000000000000000000
C: 001110001110001110001110 0 0011100011100011100011100011100
D: 000001110001110001111110 0 0000011100011100011111100000011
E: 110001111110001110000001 1 1100011111100011100000011100011
F: 001110000001111110001110 0 0011100000011111100011100011100
There is one segment on, associated with control channel 0. That is on LCD pin 14 (denoted by E in hexadecimal), input to D6 on Moteino.
As per the LCD map, this corresponds to segment 0E, which is the top segment of the rightmost seven-segment digit. All other segments on control channel 0 are off, which are mostly the top and upper-left segments of the seven segment digits; again, refer to map. So then we get the sample values for control channel 1, phase shifted 90 degrees (lag) which we said corresponds to a delta of 7 samples:
Index1 Index2
| |
V123456 7 V
0: 0000011100011100011111100000001 1 100011100011111100000011
4: 0011100011100011100011100001110 0 011100011100011100011100
7: 0011100011100011100011100001110 0 011100011100011100011100
8: 0011100011100011100011100001110 0 011100011100011100011100
9: 0011100011100011100011100001110 0 011100011100011100011100
A: 0011100011100011100011100001110 0 011100011100011100011100
B: 0000000000000000000000000000000 0 000000000000000000000000
C: 0011100011100011100011100001110 0 011100011100011100011100
D: 0000011100011100011111100000001 1 100011100011111100000011
E: 1100011111100011100000011110001 1 111100011100000011100011
F: 0011100000011111100011100001110 0 000011111100011100011100
From this we can tell segments 1D and 1E are on. Those are the center and upper-right segments of the right most digit.
Control channel 2, shifted 13 samples:
Index1 Index2
| |
V123456789012 3 V
0: 0000011100011100011111100000001110001 1 100011111100000011
4: 0011100011100011100011100001110001110 0 011100011100011100
7: 0011100011100011100011100001110001110 0 011100011100011100
8: 0011100011100011100011100001110001110 0 011100011100011100
9: 0011100011100011100011100001110001110 0 011100011100011100
A: 0011100011100011100011100001110001110 0 011100011100011100
B: 0000000000000000000000000000000000000 0 000000000000000000
C: 0011100011100011100011100001110001110 0 011100011100011100
D: 0000011100011100011111100000001110001 1 100011111100000011
E: 1100011111100011100000011110001111110 0 011100000011100011
F: 0011100000011111100011100001110000001 1 111100011100011100
Segments 2D and 2F are on, lower-left segment of rightmost digit, and the "ml" (milliliters, I would have written "mL" but they didn't do it that way) indicator.
(As an aside that I cannot resist writing, this cheap scale does not magically detect the density of the substance you are measuring. It appears to assume you are always measuring water at standard temperature and pressure, and the reading is exactly equal to the grams reading. As it is a kitchen scale, I think it is reasonable to not assume I might be pouring in molten lead or crumbled silica aerogel, but it is in fact at least slightly incorrect most of the time. Milk will deviate by 5%, and olive oil by around 10% in the other direction - common liquids found in the kitchen, that you might actually want to measure with this scale. The room is likely not at standard temperature and pressure, either. Why do they make things like this? To taunt me, clearly. This is strictly a weight measurement device, not volume under any conditions it likewise cannot detect. It also is not a mass measure, so technically grams is incorrect too, but I'll go with using it on the earth, in its gravity, close enough to sea level to make that assumption not matter. What I am
not going to do is try to figure out how many Newtons or dynes of salt to use in a recipe...)
Control channel 3, shifted 19 samples:
Index1 Index2
| |
V123456789012345678 9 V
0: 0000011100011100011111100000001110001110001 1 111100000011
4: 0011100011100011100011100001110001110001110 0 011100011100
7: 0011100011100011100011100001110001110001110 0 011100011100
8: 0011100011100011100011100001110001110001110 0 011100011100
9: 0011100011100011100011100001110001110001110 0 011100011100
A: 0011100011100011100011100001110001110001110 0 011100011100
B: 0000000000000000000000000000000000000000000 0 000000000000
C: 0011100011100011100011100001110001110001110 0 011100011100
D: 0000011100011100011111100000001110001110001 1 111100000011
E: 1100011111100011100000011110001111110001110 0 000011100011
F: 0011100000011111100011100001110000001111110 0 011100011100
Segment 3D is on - the bottom segment of the digit.
That is it! The scale reads 2 mL.
You can also see that the phase shift calculation corresponds to a "1" that is in the middle of the sequence of 1s comprising the three or four samples during the high state of the waveform of the information channels. That means we are hitting it at a time that is most likely to be correct, and not in or near a transition.
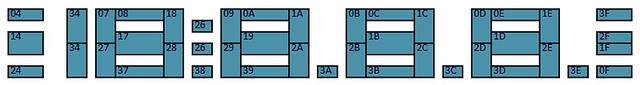
Note that I have been referring back to the LCD segment map, and here it is again for reference, but the thing is, I had to deduce this map.
So really it is the reverse process, where you look at the output and look at the scale. Then you try a different reading and see what changes. So I started with nothing, and had 0 g. All I did was change units and got 0 mL. I saw the one bit go off and the other on. Check, two segments identified. Then I put 8 grams on the scale, got one more bit, the center segment. Add one more gram, and the 8 becomes a 9, and I lost a segment. I found which bit went off, and thereby identified it. And you go on this way, eliminating overlaps and narrowing it down. The other digits followed the same pattern as the first, so it was just a matter of confirming that this was consistently true.
To get a numerical digit out of a bunch of segments, I made a decision logic tree based on what segments are on. Now, this scale will also display "Err" if you overload it, so the possibilities for a digit are 0 thru 9, and E and r. E is the same as 8 without the two right side segments, and r is represented by the lower-left segment and the center segment.
For instance, if the lower-left segment is on, the digit might be 0, 2, 6, 8, E, or r. If not, it must be 1, 3, 4, 5, 7, 9 or just off entirely. From there you whittle down the possibilities. There are 13 possibilities, 0-9, E, r, and off, so you need 4 bifurcations to get down to a decision. I was trying to identify routes that included as few segments as possible, in the hope that given the map I made, there might be a solution that used the minimum of four segments, and that the remaining three might all lie on a single information channel. If so, I would be able to not sample the pin involved for the unused channel. Alas, I was not able to do it. I am not saying there is not a mathematical solution, just that I didn't find it.
With labels A through G given to the seven segments as per this image:
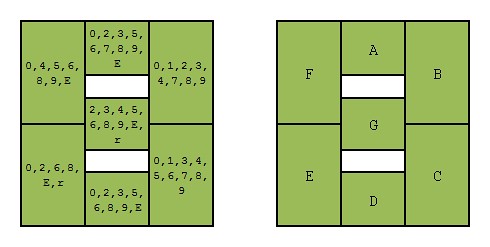
it was possible to make the decision tree given by this code:
byte InterpretSevenSegmentSet(byte A, byte B, byte C, byte D, byte E, byte F, byte G )
{
  byte digit;
  // for a given digit, we have:
  //   A
  //  F B
  //   G
  //  E C
  //   D
  // then, the algorithm is:

  if(E)
  {
    if(B)
    {
      if(G)
      {
        if(C) digit = 8;
        else  digit = 2;
      }
      else    digit = 0;
    }
    else
    {
      if(C)   digit = 6;
      else
      {
        if(A) digit = 69;  // "E"
        else  digit = 114; // "r"
      }
    }
  }
  else
  {
    if(F)
    {
      if(A)
      {
        if(B) digit = 9;
        else  digit = 5;
      }
      else    digit = 4;
    }
    else
    {
      if(A)
      {
        if(G) digit = 3;
        else  digit = 7;
      }
      else
      {
        if(B) digit = 1;
        else  digit = 0xff; // off
      }
    }
  }
  return digit;
}
The function is easy to use. Any return value over 9 can be checked for E, r, or off. I could have written 255 for the return code for off, but how could I resist writing it in hex? 0xff. It was meant to be. The other two values are the ASCII codes for those letters. I considered having the function return the ASCII codes for the digits as well, but as my aim was not to print these out as much as to use them numerically, it was best to return the raw numbers. If you want ASCII codes, just add 48 to the values, for the numerical digits.
The function can be called with the bits identified by the map. To get the rightmost digit, for instance, you can do this:
In the example above, the data set when control channel 0 is low is at index 24, that for control channel 1 is at index 31, for channel 2 it is at 37, and for 3 it is at 43. The rightmost digit is fed by information channels 13 and 14 (hex D and E). Those are on pins D5 and D6, which are both on PIND, values stored in samples[ 1 ][ x ], extractable with PIND5 and PIND6.
Armed with these values you can just call the function with these arguments:
byte digits = InterpretSevenSegmentSet(
					samples[1][24]&(1<<PIND6), // A is 0E
					samples[1][31]&(1<<PIND6), // B is 1E
					samples[1][37]&(1<<PIND6), // C is 2E
					samples[1][43]&(1<<PIND5), // D is 3D
					samples[1][37]&(1<<PIND5), // E is 2D
					samples[1][24]&(1<<PIND5), // F is 0D
					samples[1][31]&(1<<PIND5)  // G is 1D
				      );
Needless to say, you use variables in place of 24, 31, 37, and 43, so that as you find the cycle at different points in your sample, you can sample the four sections through the data at any point. If you stick with the timing and number of samples you could potentially hardcode the deltas for phase shift and save a small amount of calculation, but it is not guaranteed that it will always be the same number of samples, due to where the samples happen to fall with respect to the falling edge of the waveform, and other factors. I would do it formulaically (and did so).
So, with the safety and certainty decisions made, this set of carefully chosen samples and simple calculations work every time, consistently and robustly. Very little time is spent sampling, and the calculations are easy because there is no averaging a lot of different sample sets to try to achieve a comparable certainty by statistical weights. It just works, with a relatively small number of samples and not a lot of calculation. The hard part is getting the LCD map sorted out, but once done, it's done forever (for that model LCD). But once you've done one, you will find that others are very similar, it goes pretty quickly.
But back to sampling and calculation. The fact that it is so minimized means that it takes very little power. That is a good thing! And really, it's a kitchen scale. The samples take less than 40 milliseconds to take, to get the full reading, but does one need to sample the weight of something every 40 milliseconds? Maybe so, but chances are this cheap kitchen scale does not have that kind of signal stability in measuring changes in its Wheatstone bridge circuit. It is probably averaging several past sensor readings to stabilize the reading for human display, as jittery and sensitive as it may still seem. I find that for my purposes I really only need the reading once or twice per minute, so a poll rate of once per second is more than sufficient. The rest of the time, the MCU can simply be powered down. If it is awake and sampling once per second, for 40 ms, it is awake only 4% of the time and retains full function. Even better if I can made do with one sample per two seconds or more. That said, I want to sleep the radio on a less aggressive cycle in order to maintain comm availability. But, I don't have to sample when I wake up the MCU to further wake up the radio and check for communications.
I am still optimizing the power usage. I can't let the scale's original circuitry power down, otherwise it re-zeros on awakening. So when I am using it, I am actually preventing it from sleeping on its own, but it seems to be pretty stingy on power anyway. Maybe I will make one more modification, that being to the LED that illuminates the LCD. Simply disconnect it? Maybe. I'm out of pins so... Well, I will have to do some measurements to see just how much power that consumes. It's all about the interval at which I have to recharge the thing. For now, it has a pretty big battery for the task.
And that is about all I have on this subject - but I have some other scales I am modifying in a similar manner, and I will post those here as well, as they develop.


