
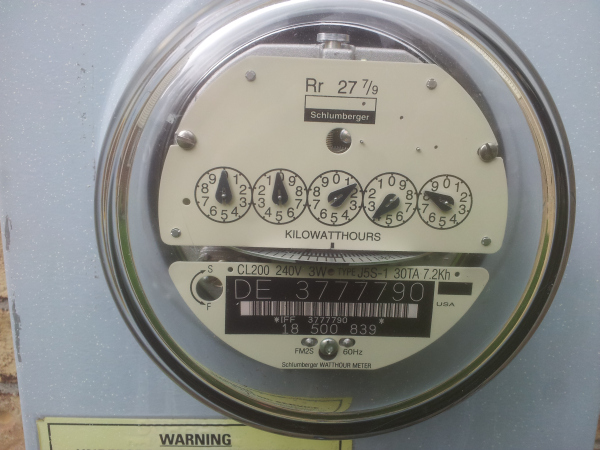
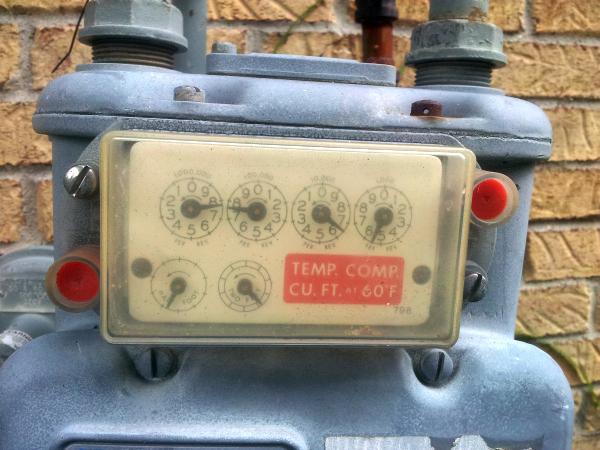
About a month ago I got a notice in the mail from DTE saying they will begin installing smart meters in my area. I didn’t expect that to happen soon since the last time I talked to them on the phone they said it was not being planned at that moment. To my surprise both the electric and gas meters were replaced/updated last week. So things can happen fast. Here are the good old meters:
 |  |
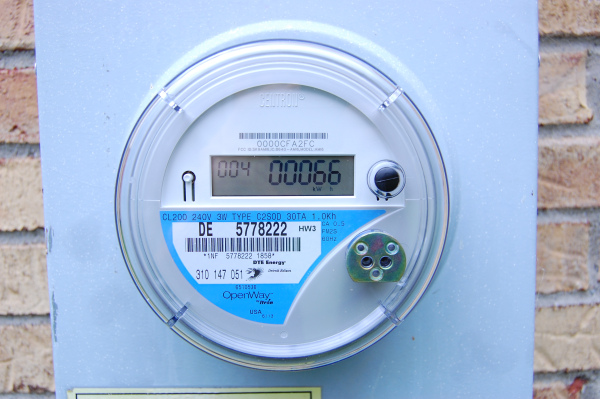
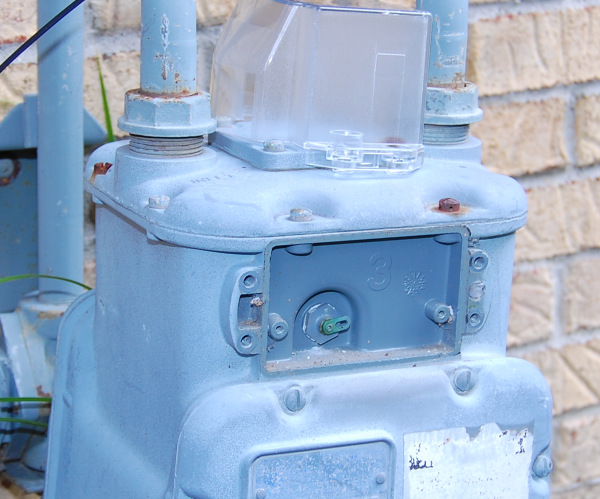
I was home on both occasions and the old electric meter was removed and replaced with a brand new Itron/Centron smart meter. Power went out for about 30 seconds. The gas meter was installed on a different day and I was happy to be able to snap some pictures. I can’t tell for sure, but from markings on the gas meter it looks like they might be using 2.4Ghz bands, a bit surprising I guess since the meters are attached to the house and those frequencies are often flooded by WiFi, and wireless everything else.
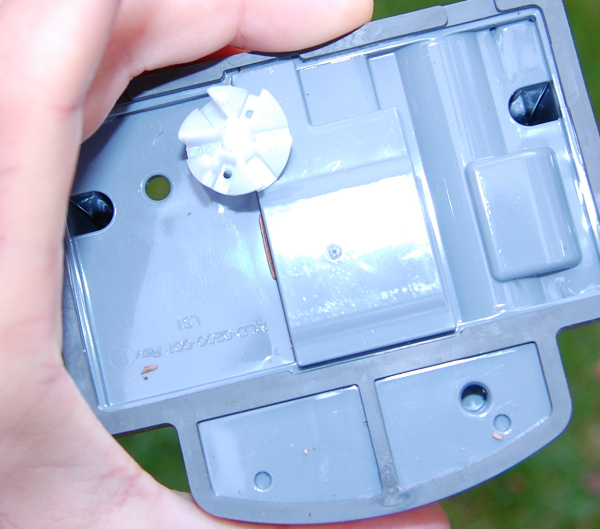
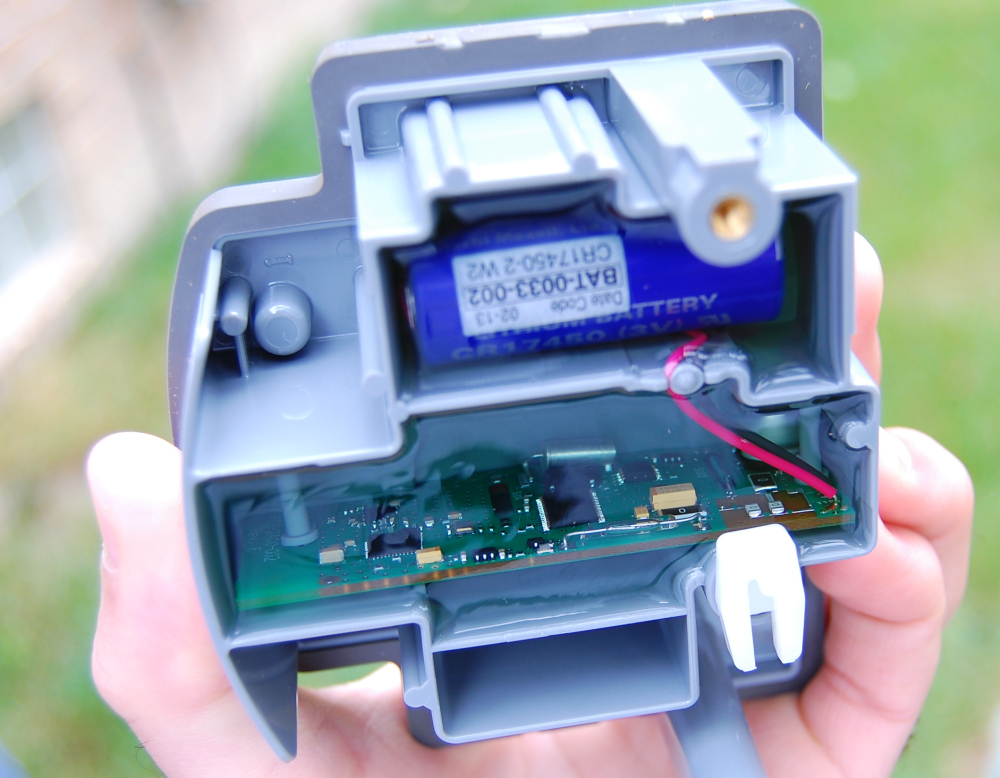
The gas meter is actually just an intermediary assembly with some electronics and 3V battery (all placed in a tacky gel), which is inserted between the meter body and the gear/dial mechanism (which stays with the meter). And a brand new clear casing is added to shelter everything.
 |  |  |  |  |
They say online energy analysis tools/graphs will be available but isn’t yet, so I’ll need to check back soon to see how useful those are, I’m curious of how granular the data will be. And of course, there won’t be any human readers patrolling my back yard, great!
With the old meters there were some issues trying to read from them with the EE-SY310 sensors. The electric meter was hit by sun most of the day and render the readings useless (unless I would enclose the glass enclosure in something to keep the light away (which would likely get me in trouble), and also the thin spinning disk with a black stripe was hard to pick up and would move slow, so barely any resolution there. The only useful solution was a an energy monitor using current transformers and ADE energy ICs. The gas meter is more shaded but the old plastic enclosure was very hazy and worn out, I tried to capture the half-foot hand which spins pretty fast but I could not. So there was no way to read the gas usage.
With the new meters there are new interesting opportunities. The electric meter has what appears to be an IR LED output which might be useful. The gas meter mechanism is still the old one and there’s a new crystal clear casing around it so I could try to pick up the half-foot hand.
I just wanted to document these interesting developments. I will try to dedicate some time to investigate if/how I can read the new meters, at least the gas which prior to this I had no way to read from.
Felix,
We have had our electric smart meter for a while now. Here is a link to some sample graphs from the collected data (http://goo.gl/Vxb1sw). The data is usually a day or two behind. Detail is at the hourly level.
Would be interested in your findings of reading the data from the meters.
Thanks, nice graphing, the only downside is the lag. If you want to see whats going on in the house from your Hawaii vacation, there’s no way, unless you have your own web connected meter. They said meters will still be visually read for a while until they get everything working with the smart meters. Still a bunch of unknowns, whether these are meshed/hopped/P2P. Don’t have a spectrum analyzer so I don’t know exactly how to capture any meter data, i’m sure its encrypted also. When I get time to get back to my ADE energy meter project I will post details.
131004-2106 EDT
I have written two short books on residential energy and power measurement. These are:
“Electrical Energy Measurement, Conservation, and Methods to Reduce Your Electric Bill”
This applies to in home measurement with Kill-A-Watt EZ and TED 1000 instruments.
“Reading, Collecting, and Using DTE Smart Meter Data to Help Reduce Energy Use”
This applies directly to the DTE residential website and the meter itself.
The DTE website information is no direct cost to the the customer and provides 0.01 kWh resolution quantized to 1 hour periods. The information is typically delayed to mid-afternoon of the day following the use of energy. Data from the meter is generally sent once per day sometime after midnight of the day of collection. A mesh network is used around 900 MHz. Very short test interrogations are made throughout the day.
Even though the DTE data has a considerable time lag there is much that can be learned from the information.
With TED monitoring I have 1 second and 10 W resolutions. If I directly collect data from the TED 1000 MTU I can get fractional watt information, but not from the newer 5000 MTU.
My website http://www.beta-a2.com/energy.html has general information on the books and includes some graphs.
.